Britain's road traffic levels reach an all-time high
Last year 324 billion miles were travelled on Britain's roads, with average delays going up to six minutes per mile in parts of the country
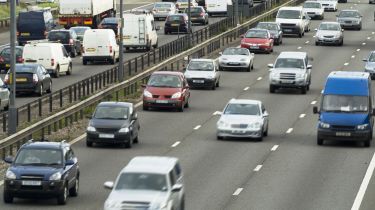
Traffic levels on Britain’s roads have reached an all-time high, with drivers facing up to six minutes of delays for every vehicle mile travelled, new figures show.
New figures from the Department for Transport show Britain’s traffic levels reached 324 billion vehicle miles travelled in 2016, a 2.2 per cent rise from the previous year, and up 50 per cent from 1979.
Average delays on the Strategic Motorway Network have now reached nine seconds for every vehicle mile travelled. Average speeds on the motorway and the A-road network fell to 59.3mph in June 2017, according to the DfT figures.
• Driving abroad: your holiday car guide
Delays on local roads were found to be much worse. Drivers now face on average 46 seconds of delays for every mile they travel, up 2.8 per cent from the previous year. Londoners were hit with the worst delays, facing on average 100 seconds for every mile, with drivers in the City of London borough facing the highest delays in the country – up to six minutes for every mile travelled.
Drivers in East of England experienced the least amount of jams, with average delays of 31.8 seconds per mile travelled.
AA spokesman, Jack Cousens said: “An average 45.9 second per mile delay on local A-roads shows that significant investment is needed to help traffic flow, in order to deliver goods and services.
“The recent announcement from Highways England delaying 16 much needed upgrades to major pinch points is a hammer blow, felt all the more so today as the increasing level of congestion is exposed.”
|
Year
|
Total road miles travelled (billions)
|
Percentage change from previous year
|
|
2005
|
306.9
| |
|
2006
|
311.4
|
1.5%
|
|
2007
|
314.1
|
0.9%
|
|
2008
|
311
|
-1.0%
|
|
2009
|
308.1
|
-0.9%
|
|
2010
|
303.2
|
-1.6%
|
|
2011
|
303.8
|
0.2%
|
|
2012
|
302.6
|
-0.4%
|
|
2013
|
303.7
|
0.4%
|
|
2014
|
311.6
|
2.6%
|
|
2015
|
316.7
|
1.6%
|
|
2016
|
323.7
|
2.2%
|
Do you think traffic now is worse than ever? Let off some steam in the comments section below...
Find a car with the experts